Megan Price
Morgan Agnew
David Peters
How to Interpret Antibody Test Results for SARS-CoV-2
As the world considers how to relax the physical-distancing measures that have been imposed to reduce the transmission of coronavirus, more and more attention is being paid to antibody, or serology, tests. A carefully-imposed testing regime may be one step in lifting lockdown measures.
Antibody tests are a way of detecting the presence (or absence) of certain proteins in the bloodstream that indicate whether a person has been exposed to SARS-CoV-2. The idea is that individuals with these proteins will have immunity – they would be protected against future infections of Covid-19, and will also be unable to transmit the virus to others. The thinking is that people who test positive for these antibodies would then be able to return to normal life, without risk for anyone else in their community. Knowing who has immunity to the virus, then, is a key component to reopening businesses, schools, and public gatherings.
It should be said that there is currently substantial scientific debate about when SARS-CoV-2 proteins are detectable after someone has had an infection, at what level (if any) they indicate an immune response, and how long that immune response might last. These are all important questions that complicate the viability of antibody testing, and we still do not have full answers. This essay focuses on a different challenge – how we can interpret the results once we do start testing.
Suppose you get tested, and the test returns a positive result. You can’t be entirely confident that this result is correct. No antibody test is perfect. All tests make mistakes a certain amount of the time — they give false negatives or positives. Typically, antibody tests publicize the rate at which they correctly identify the presence or absence of the condition they’re testing for. The public health terms ‘sensitivity’ and ‘specificity’ are used to report these rates.
Sensitivity asks: What percentage of people taking the test correctly identify as positive? Specificity asks: What percentage of people correctly identify as negative? It’s important to keep in mind that an antibody test result for coronavirus can fail in both ways – a test can indicate that you have immunity when you don’t, and it can indicate that you have no immunity when you do.
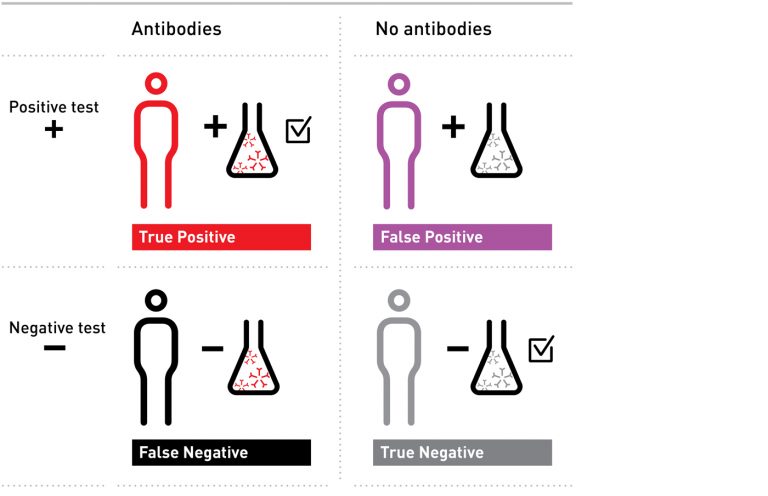
Here are the four possible results an antibody test can give — the squares on the top right and bottom left show incorrect results — those with a positive result, who do not have antibodies (false positives), and those with a negative result, who do have antibodies (false negatives).
The question we’d like to answer is: if you get a positive test, what is the probability you actually do have the antibodies you were tested for? Before we can get to a meaningful answer to that question though, we have to apply a certain amount of math and science.
Let’s consider an example. Imagine a population of 100 people, ten of whom have the antibodies. Say we have a test with 90% sensitivity and 80% specificity, and we give the test to everyone in our small population.
The sensitivity of the test tells us that of the ten people with antibodies, 90% – nine in our example – will correctly test positive, and one will falsely test negative. The specificity of the test tells us that of the 90 people without antibodies, 80% of them – or 72 – will correctly test negative, but that the other 18 will falsely test positive.
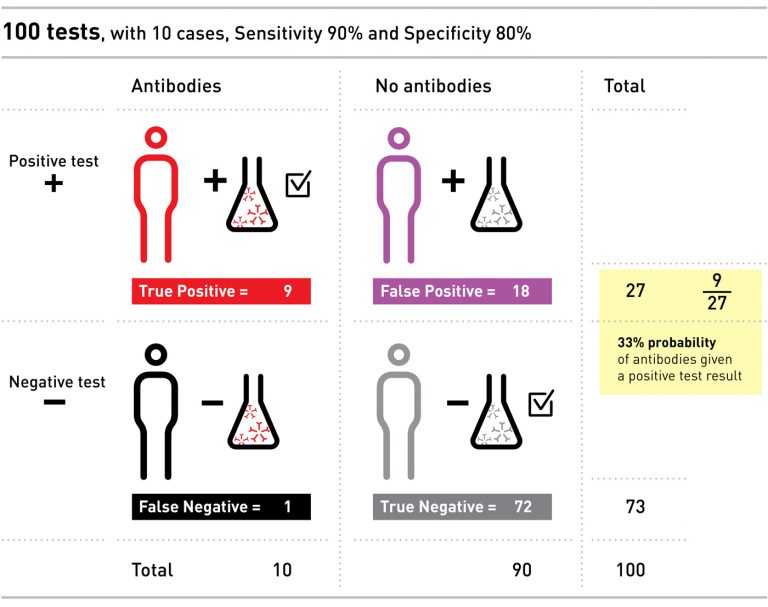
Even though we only had ten people with the antibodies, we ended up with 27 positive tests: nine of these people do have the antibodies, and 18 people have a false positive.
If you were one of those 27 people with a positive result, the probability that you actually had the antibodies would only be 9 out of 27 – or 33%. If this were a real test for coronavirus, and the idea was to allow you back into normal life after testing positive for antibodies, without creating risk for yourselves and others, it is clear that a positive test with only 33% chance of being correct is not very convincing, and could do more harm than good.
Note that the real chance that a positive test is correct – 33% – is a lot lower than the percentages we were given for sensitivity and specificity (90% and 80%). We needed to do some work to get from those two figures to the answer of our original question — for an individual, what is the chance that his or her positive test result is correct?
There’s a mathematical way to phrase this question: Given a positive test result, what is the probability that an individual has antibodies? Expressed in mathematical notation, the question is written P(antibodies | positive test). (The | here means given).

To move from what we know about the test to what we want to know about our result, we put something called Bayes Theorem into action:
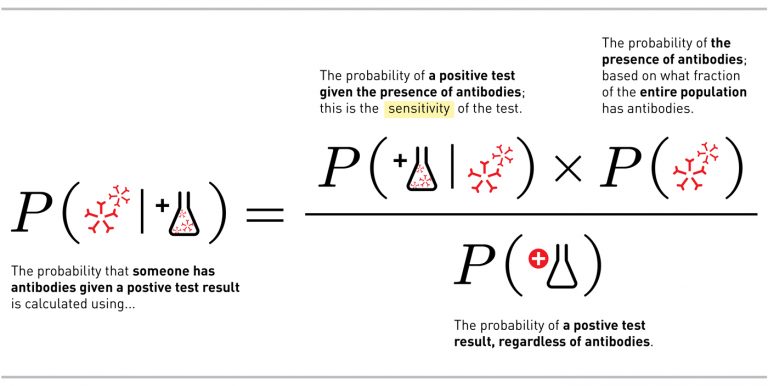
There are two important takeaways from the math. The first is the difference between what we want to know if we get a positive test result and what we actually know about the test, the sensitivity, which we discussed above. Many people confuse the two, but they are very different.
This leads us to the next important takeaway — the importance in the math of P(antibodies) — which describes how many people in the total population have recovered from infection and now have antibodies.
This element — the true number of recovered individuals in the population — has a fundamental impact on the interpretation of antibody testing. When the population has a very low rate of infection, we see more false positives. When P(antibodies) is small, the opposite, P(no antibodies), must be large, and this latter term determines how many false positives there are.
To see how this works, let’s return to the example above. In that case, we imagined a small population of 100 people, 10 of whom – or 10% – had antibodies. Administering a test with 80% specificity resulted in 18 false positives. Now let’s imagine the same 10 people with antibodies in a larger population of 1,000 – so only 1% of people have antibodies. Administering the exact same test, with the same specificity, now results in 198 false positives, and only a 4% chance of having the antibodies if you test positive.
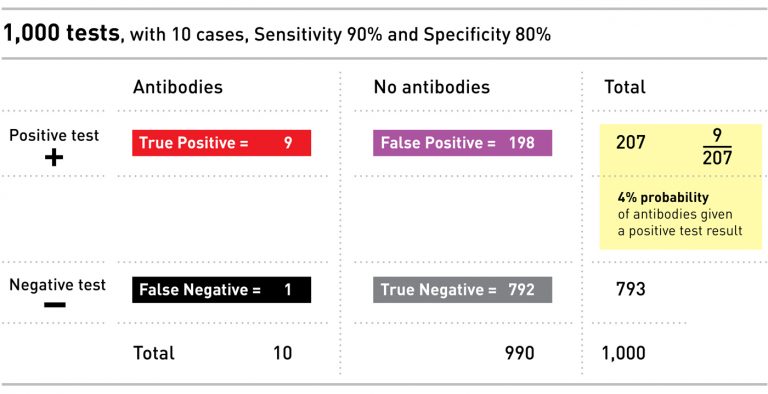
The importance of the infection rate is what makes antibody testing so complicated: because we still don’t know what the infection rate is, we can’t be sure how to interpret an individual’s test result.
Guesses for the infection rate in the United States, for example, vary from 1% to 10%. There’s a significant difference between those two numbers, with large implications for the interpretation of antibody testing. In many ways a lower number would be good news — fewer infected individuals means fewer sick individuals, and that is a good thing. However, when applied to antibody test results, fewer infected individuals means many more false positives. And in this particular case, more false positives would mean more individuals who wrongly think they are protected against Covid-19, or that they are not at risk of spreading Covid-19.
In the US, the Food and Drug Administration has granted emergency use authorization to only one antibody test so far, but many more are in development.1 The tests range from 88% to 97% for sensitivity and 91% to 99% for specificity. Let’s walk through the above equations using the highest-reported rates for these tests, to present the best-case scenario.
Given a positive test result, what is the probability that someone has antibodies? Here’s how we’ll fill out the theorem to answer this question:
P(antibodies | positive test) = this is what we want to know
P(positive test | antibodies) = 0.97
P(antibodies) = somewhere between 0.01 to 0.1
To complicate things, there’s one more part of the theorem we haven’t discussed yet, and that’s the probability of a positive test. This includes all the people who test positive, regardless of antibodies. That means that P(positive test) includes both the true positives (people who really have antibodies) and the false positives (people who don’t have antibodies but get a positive test).
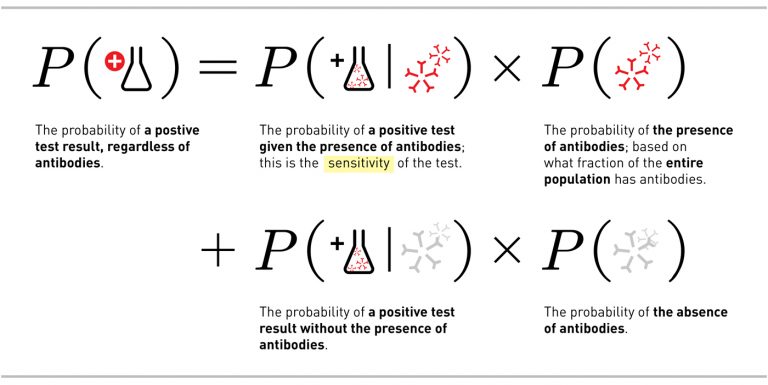
With that in mind, let’s look at what happens when our most effective test (with 97% sensitivity and 99% specificity) is used to test a population with a 1 per cent infection rate (that’s the bottom end of the guesses on rate of infection for the United States). For this example we get the following equation:

Which leads to:

Simply put, if someone gets a positive antibody test, of the best kind currently available, and the true recovered population is about 1%, there is only a 49% chance that the person will actually have antibodies. You wouldn’t know very much more than you did before you took the test.
What happens if the underlying prevalence is higher? Take the same antibody test and apply it to the other extreme of the guesses, where 10% of the population is recovered, and you get:

In that case, if you took the antibody test and tested positive, you’d have a 97% chance of actually having the antibodies.
What doing the math tell us is that one of the most important, unknown variables when it comes to antibody testing is infection rate. The more recovered people there are in a population, the higher the chances that an individual’s positive test is correct — but our current guesses of that rate give us two very different possible scenarios, one in which you could be nearly certain of a correct positive test result, and another when you’d only have a fifty per cent chance.
That doesn’t mean antibody testing isn’t useful. These tests could be very useful in targeted populations with known higher exposures (for example, essential workers in healthcare, grocery stores, etc). But among the general population, it would still be very dangerous for us to assume that a single positive antibody test means we are protected from future infection.
The above math, again, all relies on an antibody testing with the highest sensitivity and specificity of all the tests currently being discussed. Experts at Oxford University, though, have reported that the best tests are only achieving 70% sensitivity in practice, and the White House Coronavirus Task Force recently recommended a minimum specificity of 90%.
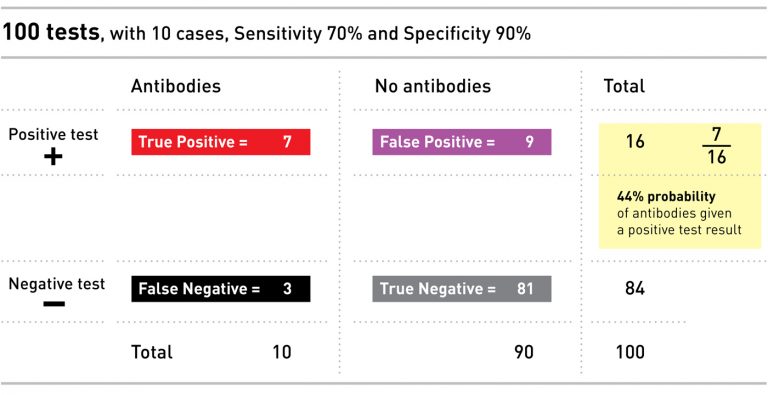
Unfortunately, neither of these reports mention both sensitivity and specificity, which are needed for a complete calculation. But if we repeat the above math using the Oxford University reported sensitivity of 70% and the Task Force recommended minimum specificity of 90%, in a population where 10% of folks have antibodies, the probability that you have the antibodies if you get a positive test result is 44%. Worse than a coin toss.
We can imagine this test applied to our example population of 100 people, 10 of whom (or 10%) have antibodies:
Again, antibody tests are still very useful, and will be a necessary step in whatever comes after sheltering in place and physical distancing. Policies can certainly be informed by the results of these tests in aggregate, over a whole population. But their interpretation on an individual level is not straightforward. As Professor Thomas Lumley writes, ‘counting rare things is hard’.
Fortunately, this is a common problem in public health. Typically these kinds of screening tests are the beginning of a person’s interaction with the healthcare system. A positive test result may be followed by additional (sometimes more invasive) testing or discussion of options with a physician. Screening tests, like the antibody tests discussed here, are a useful tool, but should not be used or interpreted in isolation. We will know more as more information is collected from these and other tests. With what we know right now, we share the WHO’s conclusion that it is far too early to assume that a single test result is sufficient for an individual to draw a conclusion about his or her immunity to Covid-19.
Endnotes
1. The Cellex SARS-CoV-2 IgG/IgM Rapid Test is currently the only one granted emergency authorization (see https://www.fda.gov/media/136625/download), but Abacus Pharma International (https://covid-rapid.com/pages/for-doctors), Biomedics (https://www.biomedomics.com/products/infectious-disease/covid-19-rt/), CTK Biotech (https://ctkbiotech.com/covid-19/) and others are also marketing rapid tests.
We are grateful for comments and feedback provided by Patrick Ball as well as the Granta editors and research conducted by Tarak Shah.
All illustrations by David Peters. Test tube photo by Marco Verch, modified by David Peters, CC BY 2.0.


